


The 2008 Mets finished close to the middle of the pack in Homeruns and Slugging %.
Of the 16 National League teams, the Mets were 6th in Homeruns and 7th in Slugging %. Moreover, they only finished 12th overall in Doubles.
Despite the occasional frustrating lack of pop, they did manage to finish 2nd in Runs, 4th in Hits and had the 4th highest team Batting Average in the league.
But the question still remains--do they lack power?
Thus far, in 2009, the power has not shown up.
Jerry Manuel is emphasizing his version of small ball this year--let's call it Jerry Ball--and, as Marty Noble of MLB.com wrote back at the end of Spring Training, Jerry wants, "More Lemke, less McGwire."
PORT ST. LUCIE, Fla. -- Among the defeats the Mets endured during their September slide last season was one that particularly distressed their manager, because he was certain that it could have been averted had his hitters not adhered to their routine practices.But is this really accurate? Did the Mets need more "small ball" down the stretch, or was it the lack of big hits, power hits, that ultimately sealed their fate.
That night, Jerry Manuel would have paid a princely sum for a swing that perhaps would have produced a foul ball to extend a critical at-bat. He would have been quite content with a ground ball to advance a runner rather than a perfect and mighty swing designed to create a hero.
For want of a small-ball component -- more contentious at-bats, a properly placed ground ball -- the Mets lost that night, prompting Manuel to lament during the postmortems: "There are things we can do to win games that we don't always try. ... There's more than one way to skin a cat."
Let's look at the game logs from September and try to see if we can spot the flaws.
In the month of September the Mets his 29 homeruns. While that looks like a decent amount, of the 25 games they played, no homeruns were hit in 10.
The Mets went 3-7 in those games.
The Mets hit their third fewest amount of HRs in September. The worst month was March/April, followed by June.
Their record in those months?
14-12 in March/April
13-15 in June
13-12 in September.
On the season, the Mets hit 124 homeruns in wins, and only 48 homeruns in losses.
In 2009 the Mets have only hit 9 homeruns. Only one player, Carlos Delgado, has more than one.
The team stands at 5-5.
So while I applaud Jerry wanting his guys to use the whole field, move runners along, and keep the lineup rotating, there is something to be said for the good old fashioned 3-run bomb.
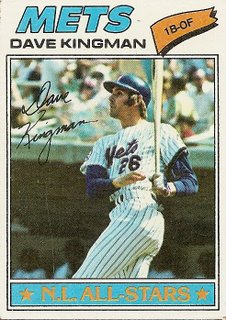
What the team really needs is to channel their inner Kingman.
| Team Aggregate Stats: 2009 | ||||||||||||||
| RK | TEAM | GP | AB | R | H | 2B | 3B | HR | TB | RBI | BA | OBP | SLG | OPS |
| 1 | Texas | 10 | 358 | 74 | 105 | 22 | 3 | 22 | 199 | 73 | .293 | .360 | .556 | .916 |
| 2 | Toronto | 12 | 436 | 82 | 134 | 30 | 2 | 21 | 231 | 76 | .307 | .370 | .530 | .899 |
| 3 | Tampa Bay | 11 | 377 | 57 | 100 | 28 | 1 | 19 | 187 | 55 | .265 | .337 | .496 | .833 |
| 4 | NY Yankees | 11 | 381 | 59 | 100 | 25 | 2 | 17 | 180 | 54 | .262 | .341 | .472 | .814 |
| 5 | St. Louis | 12 | 408 | 72 | 122 | 26 | 2 | 16 | 200 | 72 | .299 | .376 | .490 | .866 |
| 6 | Cleveland | 11 | 380 | 58 | 100 | 26 | 0 | 14 | 168 | 54 | .263 | .365 | .442 | .807 |
| 7 | Chicago Cubs | 10 | 338 | 52 | 88 | 19 | 0 | 14 | 149 | 51 | .260 | .360 | .441 | .801 |
| 8 | Colorado | 9 | 296 | 47 | 68 | 19 | 1 | 14 | 131 | 44 | .230 | .313 | .443 | .756 |
| 9 | Boston | 10 | 347 | 47 | 88 | 18 | 2 | 13 | 149 | 44 | .254 | .342 | .429 | .771 |
| 10 | Chicago Sox | 10 | 335 | 42 | 87 | 12 | 2 | 13 | 142 | 41 | .260 | .331 | .424 | .755 |
| RK | TEAM | GP | AB | R | H | 2B | 3B | HR | TB | RBI | BA | OBP | SLG | OPS |
| 11 | Milwaukee | 10 | 324 | 45 | 73 | 22 | 1 | 13 | 136 | 44 | .225 | .326 | .420 | .746 |
| 12 | Detroit | 10 | 338 | 59 | 95 | 15 | 3 | 12 | 152 | 58 | .281 | .369 | .450 | .819 |
| 13 | San Diego | 11 | 354 | 52 | 89 | 18 | 3 | 12 | 149 | 51 | .251 | .329 | .421 | .750 |
| 14 | Baltimore | 10 | 348 | 64 | 101 | 25 | 1 | 11 | 161 | 62 | .290 | .378 | .463 | .840 |
| 15 | Atlanta | 10 | 338 | 45 | 89 | 22 | 3 | 11 | 150 | 44 | .263 | .332 | .444 | .776 |
| 16 | Florida | 10 | 347 | 61 | 97 | 14 | 4 | 11 | 152 | 59 | .280 | .352 | .438 | .790 |
| 17 | Arizona | 10 | 328 | 38 | 75 | 20 | 2 | 11 | 132 | 38 | .229 | .297 | .402 | .699 |
| 18 | Kansas City | 10 | 335 | 43 | 82 | 21 | 4 | 10 | 141 | 42 | .245 | .326 | .421 | .747 |
| 19 | Washington | 9 | 325 | 44 | 91 | 19 | 0 | 10 | 140 | 42 | .280 | .359 | .431 | .790 |
| 20 | Minnesota | 12 | 408 | 50 | 103 | 18 | 4 | 9 | 156 | 49 | .252 | .313 | .382 | .695 |
| RK | TEAM | GP | AB | R | H | 2B | 3B | HR | TB | RBI | BA | OBP | SLG | OPS |
| 21 | Houston | 10 | 327 | 27 | 76 | 13 | 3 | 9 | 122 | 27 | .232 | .303 | .373 | .676 |
| 22 | LA Dodgers | 11 | 371 | 59 | 103 | 19 | 3 | 9 | 155 | 58 | .278 | .375 | .418 | .793 |
| 23 | NY Mets | 10 | 339 | 52 | 96 | 18 | 0 | 9 | 141 | 48 | .283 | .369 | .416 | .785 |
| 24 | Philadelphia | 9 | 310 | 49 | 85 | 21 | 3 | 9 | 139 | 49 | .274 | .345 | .448 | .793 |
| 25 | Pittsburgh | 10 | 340 | 41 | 88 | 20 | 4 | 9 | 143 | 40 | .259 | .318 | .421 | .739 |
| 26 | Seattle | 11 | 357 | 53 | 93 | 16 | 0 | 8 | 133 | 49 | .261 | .317 | .373 | .690 |
| 27 | Cincinnati | 9 | 280 | 38 | 62 | 13 | 1 | 8 | 101 | 38 | .221 | .330 | .361 | .691 |
| 28 | LA Angels | 10 | 344 | 45 | 91 | 18 | 1 | 7 | 132 | 44 | .265 | .332 | .384 | .716 |
| 29 | San Francisco | 10 | 321 | 35 | 76 | 17 | 2 | 6 | 115 | 30 | .237 | .293 | .358 | .652 |
| 30 | Oakland | 10 | 356 | 45 | 88 | 15 | 2 | 3 | 116 | 43 | .247 | .328 | .326 | .654 |
| LEAGUE AVERAGES | GP | AB | R | H | 2B | 3B | HR | TB | RBI | BA | OBP | SLG | OPS | |
| American League | 11 | 364 | 56 | 98 | 21 | 2 | 13 | 161 | 53 | .267 | .344 | .439 | .783 | |
| National League | 10 | 334 | 47 | 86 | 19 | 2 | 11 | 141 | 46 | .256 | .336 | .420 | .756 | |
| Major League Baseball | 10 | 348 | 51 | 92 | 20 | 2 | 12 | 150 | 49 | .262 | .340 | .429 | .769 | |
![Reblog this post [with Zemanta]](http://img.zemanta.com/reblog_e.png?x-id=2cb8d236-1ae1-415a-9488-56c14f3754bb)


No comments:
Post a Comment